The National Association of Realtors (NAR) keeps historic data on many aspects of homeownership. One of the data points that has changed dramatically is the median tenure of a family in a home. As the graph below shows, for over twenty years (1985-2008), the median tenure averaged exactly six years. However, since 2008, that average is almost nine years – an increase of almost 50%.Why the dramatic increase?The reasons for this change are plentiful. The top two reasons are:The fall in home prices during the … [Read more...]
Percentage of Homeownership by Decade and by State
There has been a lot of talk about the falling homeownership rate in the United States. In December 2004, the homeownership rate reached an all-time high of 69.4%, while the current rate is 62.9%. When comparing these two figures, there is some room for concern regarding the difference.However, today we want to shine some light on the issue by:Showing what historic homeownership rates have looked like over the last 130 years.Breaking down the current percentages by state.Historic Homeownership Rates:Current … [Read more...]
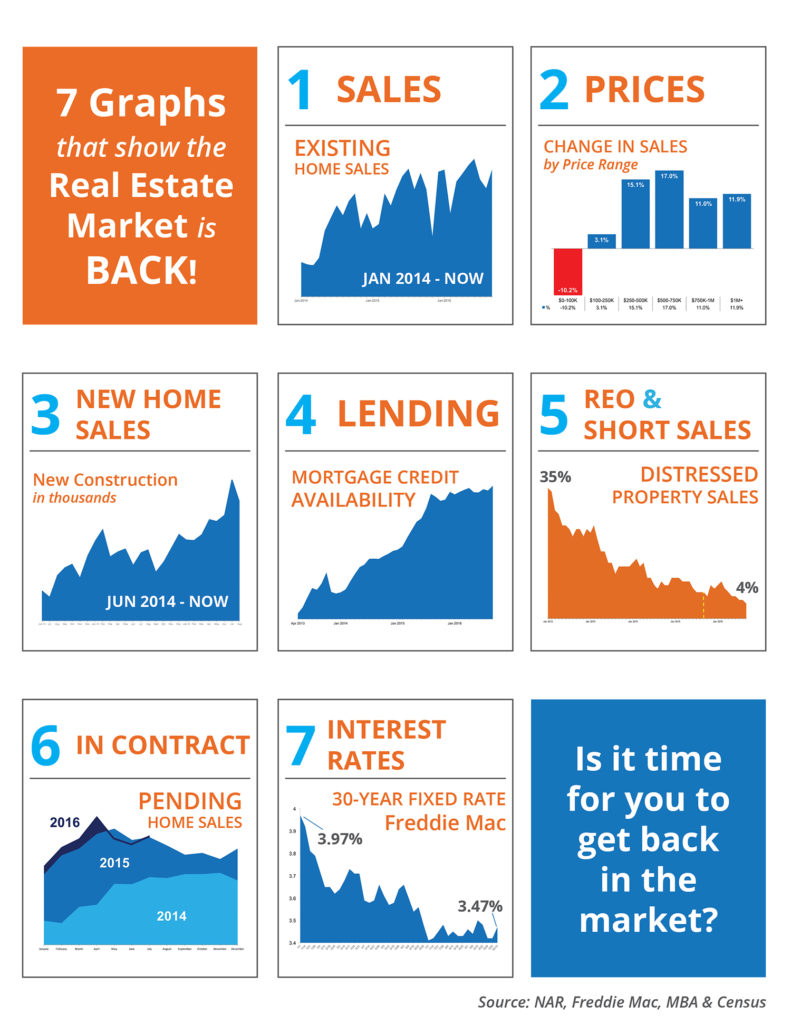
7 Graphs That Show the Real Estate Market is Back! [INFOGRAPHIC]
Some Highlights:Distressed property sales fell to its lowest number since NAR began tracking it in 2008.As you can see, with less distressed properties, sales are up in all price ranges except the $0 - $100K price range.Interest rates are still at historic lows, signifying that now is the right time to buy! … [Read more...]
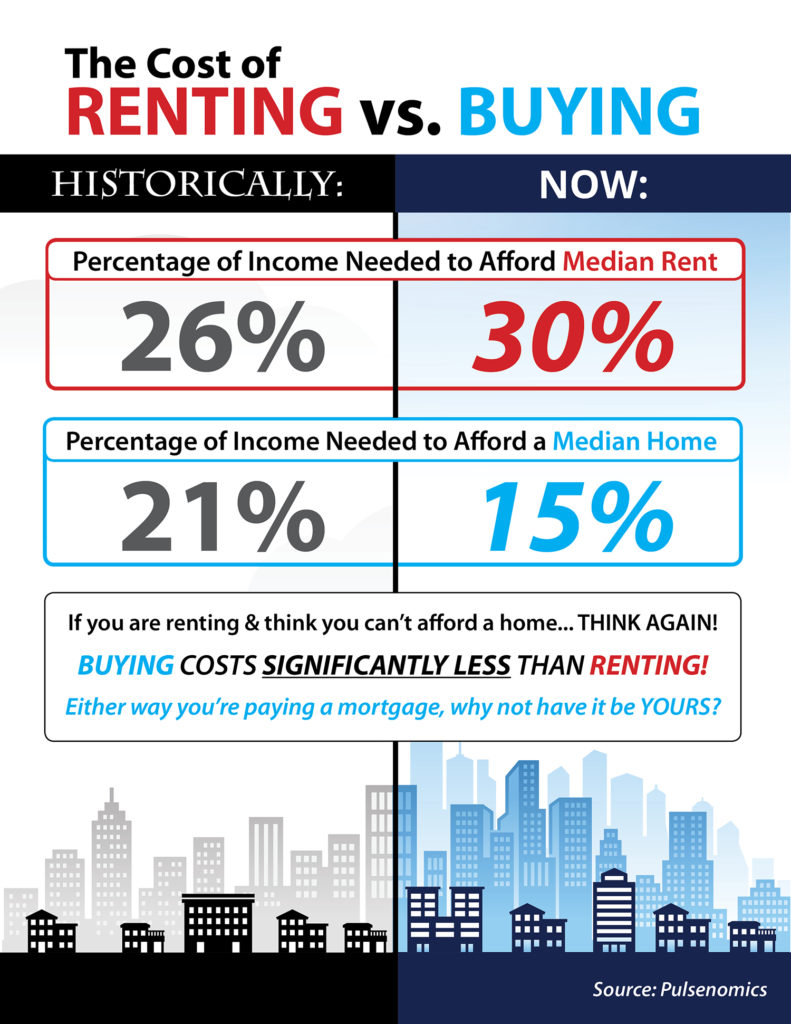
Do You Know the Cost of Renting vs. Buying? [INFOGRAPHIC]
Some Highlights:Historically, the choice between renting or buying a home has been a close decision.Looking at the percentage of income needed to rent a median priced home today (30%) vs. the percentage needed to buy a median priced home (15%), the choice becomes obvious.Every market is different. Before you renew your lease again, find out if you could use your housing costs to own a home of your own! … [Read more...]
The Past, Present & Future of Home Prices
CoreLogic released their most current Home Price Index last week. In the report, they revealed home appreciation in three categories: percentage appreciation over the last year, over the last month and projected over the next twelve months.Here are state maps for each category: The Past – home appreciation over the last 12 monthsThe Present – home appreciation over the last monthThe Future – home appreciation projected over the next 12 monthsBottom LineHomes … [Read more...]
Why We Need More Newly Constructed Homes
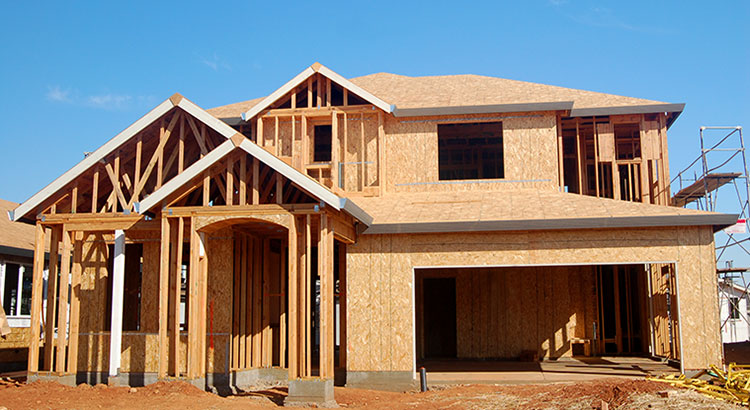
The number of new home sales is far off historic norms. The National Association of Realtors (NAR) just reported that the percentage of all house sales that were newly constructed homes has fallen to the lowest numbers in forty years. Here is a graph showing the percentages:This should come as no surprise as the number of new housing starts has fallen dramatically over the last several years:Bottom LineWe need more new construction for two reasons:It will relieve some of the pent-up buying demand that is causing … [Read more...]
Strong Buyer Demand Continues to Outpace Inventory of Homes for Sale
The price of any item is determined by the supply of that item, as well as the market demand. The National Association of REALTORS (NAR) surveys “over 50,000 real estate practitioners about their expectations for home sales, prices and market conditions” for their monthly REALTORS Confidence Index.Their latest edition sheds some light on the relationship between Seller Traffic (supply) and Buyer Traffic (demand).Buyer DemandThe map below was created after asking the question: “How would your rate … [Read more...]
Lack of Existing Home Sales Inventory Impacting Sales [INFOGRAPHIC]
Some Highlights:Existing home inventory is down 10.1% from last year.A lack of inventory explains the modest increase in home sales (0.8% year-over-year) despite strong buyer demand.Existing home prices increased 5.1% year-over-year, which is directly related to the lack of inventory. … [Read more...]
Home Sales Expected to Increase Nicely in 2017
The National Association of Realtors, The Mortgage Bankers’ Association, Freddie Mac and Fannie Mae are all projecting that home sales will increase in 2017. Here is a chart showing what each entity is projecting in sales for this year and the next.As we can see, each is projecting sizable increases in home sales next year. If you have considered selling your house recently, now may be the time to put it on the market. … [Read more...]
US Housing Market Moving Further into ‘Buy Territory’
According to the latest Beracha, Hardin & Johnson Buy vs. Rent (BH&J) Index, the U.S. housing market has continued to move deeper into buy territory, supporting the belief that housing markets across the country remain a sound investment.The BH&J Index is a quarterly report that attempts to answer the question:In today’s housing market, is it better to rent or buy a home?The index examines the entire US housing market and then isolates 23 major cities for comparison. The researchers … [Read more...]
- « Previous Page
- 1
- …
- 80
- 81
- 82
- 83
- 84
- …
- 88
- Next Page »


