Some Highlights: Historically, the choice between renting or buying a home has been a tough decision. Looking at the percentage of income needed to rent a median-priced home today (29.2%) vs. the percentage needed to buy a median-priced home (15.8%), the choice becomes obvious. Every market is different. Before you renew your lease again, find out if you can put your housing costs to work by buying this year! … [Read more...]
Top Home Renovations for Maximum ROI [INFOGRAPHIC]

Some Highlights: Whether you are selling your home, just purchased your first home, or are a homeowner planning to stay put for a while, there is value in knowing which home improvement projects will net you the most Return On Investment (ROI). While big projects like adding a bathroom or a complete kitchen remodel are popular ways to increase a home’s value, something as simple as updating landscaping and curb appeal can have a quick impact on a home’s value. For more information about top renovation … [Read more...]
The Impact Your Interest Rate Makes [INFOGRAPHIC]

Some Highlights: Interest rates have come a long way in the last 30 years. The interest rate you secure directly impacts your monthly payment and the amount of house that you can afford if you plan to stay within a certain budget. Interest rates are at their lowest in years… RIGHT NOW! If buying your first home, or moving up to the home of your dreams is in your future, now may be the time to act! … [Read more...]
What Would You Sacrifice to Save For Your Next Home? [INFOGRAPHIC]

Some Highlights: 95% of first-time homebuyers are willing to sacrifice to make homeownership a reality. The top item that buyers sacrifice is new clothes, at 54%. Even repeat or experienced buyers say they sacrificed taking a vacation or buying a new car to buy their last home. … [Read more...]
Inventory Challenges Continue! [INFOGRAPHIC]

Some Highlights: After a surge in March, existing home sales and new home sales slowed due to a drop in inventory available for sale in the start-up and trade-up categories. Median existing home prices surged for the 62nd straight month, up 6.0% over last year to $244,800. New home prices slowed as builders have started to turn their focus toward single family, smaller homes. … [Read more...]
Why Americans Consider Moving to Another State? [INFOGRAPHIC]

Some Highlights:In a recent Harris Poll, Americans listed "change in climate/weather" as their top reason for wanting to relocate.41% would move for a “better job opportunity.”Being closer to loved ones filled out 3 of the top 6 reasons why Americans move. … [Read more...]
What You Need to Know About Qualifying for a Mortgage [INFOGRAPHIC]
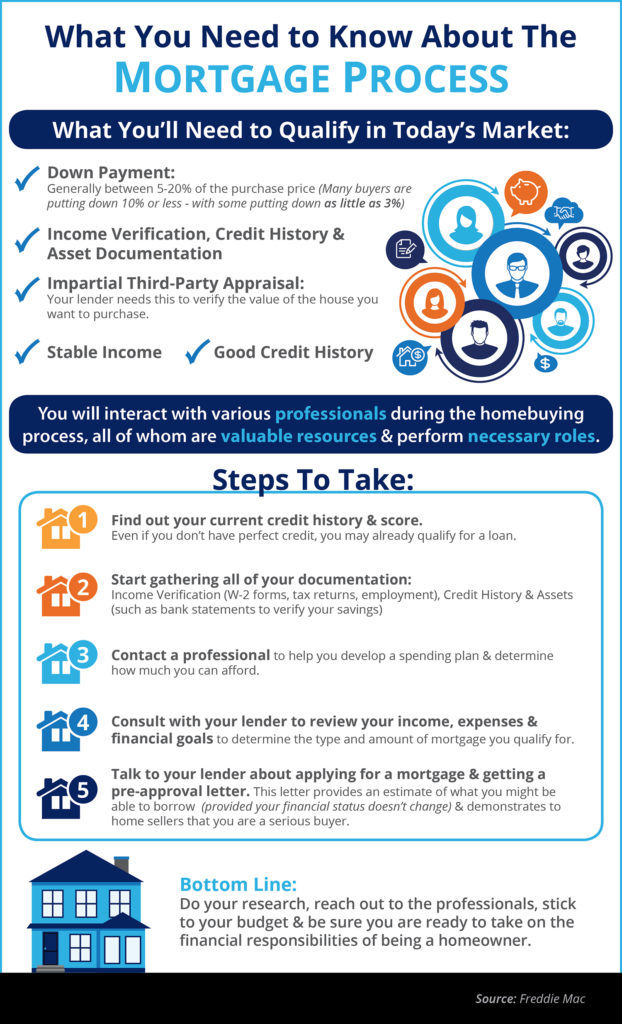
Some Highlights:Many buyers are purchasing a home with a down payment as little as 3%.You may already qualify for a loan, even if you don't have perfect credit.Take advantage of the knowledge of your local professionals who are there to help you determine how much you can afford. … [Read more...]
Do You Know the Cost of Waiting? [INFOGRAPHIC]

Some Highlights: The “Cost of Waiting to Buy” is defined as the additional funds it would take to buy a home if prices and interest rates were to increase over a period of time.Freddie Mac predicts that interest rates will increase to 4.8% by this time next year, while home prices are predicted to appreciate by 4.9% according to CoreLogic.Waiting until next year to buy could cost you thousands of dollars a year for the life of your mortgage! … [Read more...]
Homes are Selling Fast Across the Country [INFOGRAPHIC]

Some Highlights:The National Association of REALTORS® surveyed their members for their monthly Confidence Index.The REALTORS® Confidence Index is a key indicator of housing market strength based on a monthly survey sent to over 50,000 real estate practitioners. Practitioners are asked about their expectations for home sales, prices and market conditions.Homes sold in 60 days or less in 36 out of 50 states, and Washington D.C.Homes typically went under contract in 34 days in March! … [Read more...]
Slaying Home Buying Myths [INFOGRAPHIC]

Some Highlights:Interest rates are still below historic numbers.88% of property managers raised their rent in the last 12 months!The credit score requirements for mortgage approval continue to fall. … [Read more...]
- « Previous Page
- 1
- …
- 37
- 38
- 39
- 40
- 41
- …
- 44
- Next Page »