
Some Highlights:‘Millennials’ are defined as 18-36 year olds according to the US Census Bureau.According to NAR’s latest Profile of Home Buyers & Sellers, the median age of all first-time home buyers is 31 years old.More and more ‘Old Millennials’ (25-36 year olds) are realizing that homeownership is within their reach now! … [Read more...]
Why Millennials Choose to Buy [INFOGRAPHIC]
Some Highlights:“The majority of millennials said they consider owning a home more sensible than renting for both financial and lifestyle reasons — including control of living space, flexibility in future decisions, privacy and security, and living in a nice home.”At 93%, the top reason Millennials choose to buy is to have control over their living space.Many Millennials who rent a home or apartment prior to buying their own homes dream of the day that they will be able to paint the walls … [Read more...]
Home Prices Up 6.15% Across the Country! [INFOGRAPHIC]
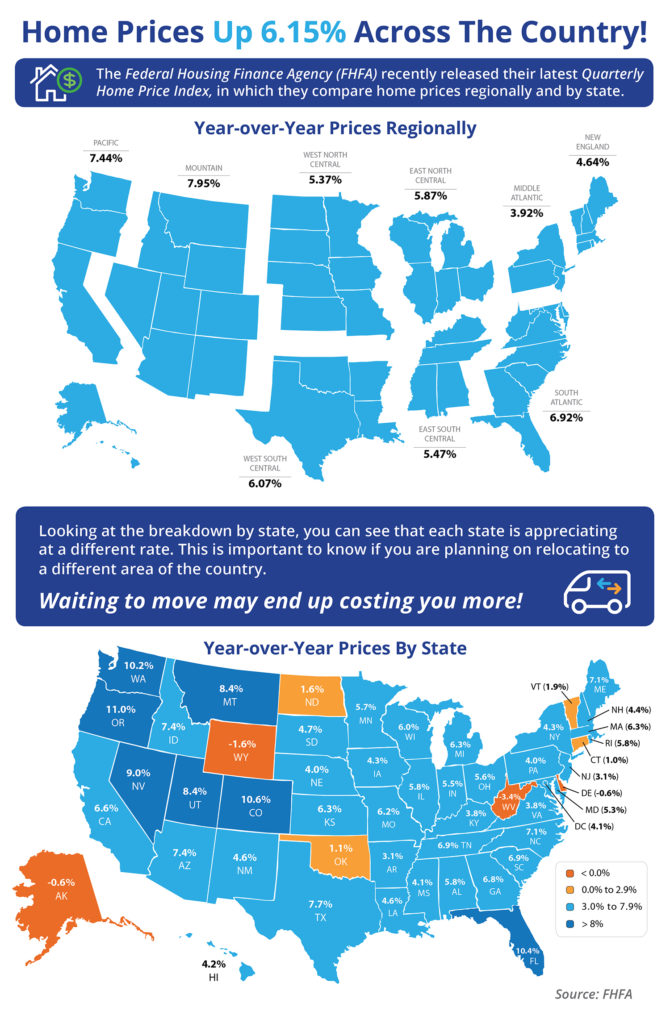
Some Highlights:The Federal Housing Finance Agency (FHFA) recently released their latest Quarterly Home Price Index report.In the report, home prices are compared both regionally and by state.Based on the latest numbers, if you plan on relocating to another state, waiting to move may end up costing you more!Alaska, Delaware, West Virginia & Wyoming were the only one states where home prices are lower than they were last year. … [Read more...]
How Low Supply & High Demand Impacts the Real Estate Market [INFOGRAPHIC]
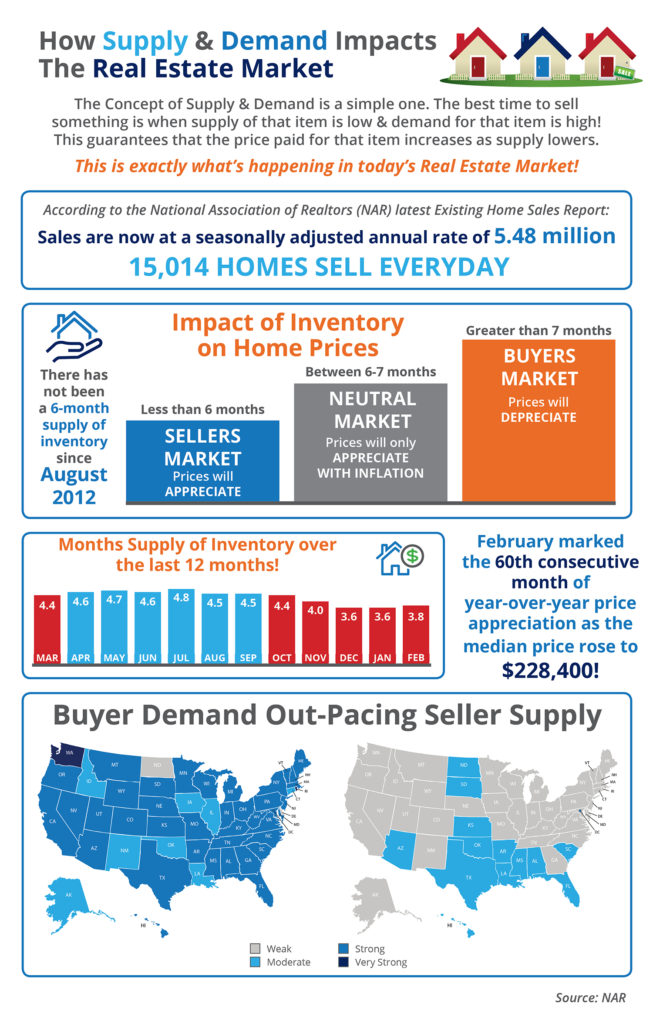
Some Highlights:The concept of Supply & Demand is a simple one. The best time to sell something is when the supply of that item is low & the demand for that item is high!Anything under a 6-month supply is a Seller’s Market!There has not been a 6-months inventory supply since August 2012!Buyer Demand continues to outpace Seller Supply! … [Read more...]
Don’t Let Your Luck Run Out [INFOGRAPHIC]
Some Highlights: The “Cost of Waiting to Buy” is defined as the additional funds it would take to buy a home if prices and interest rates were to increase over a period of time.Freddie Mac predicts that interest rates will increase to 4.8% by this time next year, while home prices are predicted to appreciate by 4.8% according to CoreLogic.Waiting until next year to buy could cost you thousands of dollars a year for the life of your mortgage! … [Read more...]
Where Did Americans Move in 2016?
Some Highlights:For the 5th year in a row, the Northeast saw a concentration of “High Outbound” activity.For the first time ever, South Dakota held the top spot for “High Inbound” states.Much of America’s outbound activity can be attributed to Boomers relocating to warmer climates after retiring. … [Read more...]
Existing Home Sales Reach Highest Mark Since 2007 [INFOGRAPHIC]
Highlights:Sales of existing homes reached the highest pace in a decade at a seasonally adjusted annual rate of 5.69 million.January marked the 59th consecutive month of year-over-year price gains as the median home price rose 7.1% to $228,900.NAR’s Chief Economist, Lawrence Yun had this to say, “Much of the country saw robust sales activity last month as strong hiring and improved consumer confidence at the end of last year appear to have sparked considerable interest in buying a home." … [Read more...]
5 Reasons to Love Using A RE Pro [INFOGRAPHIC]
Highlights:Hiring a real estate professional to guide you through the process of buying a home or selling your house can be one of the best decisions you make!They are there for you to help with paperwork, explaining the process, negotiations, and helping you with pricing (both when making an offer or setting the right price for your home).One of the top reasons to hire a real estate professional is their understanding of your local market and how the conditions in your neighborhood will impact your experience. … [Read more...]
5 Reasons Homeowners Throw Better Super Bowl Parties! [INFOGRAPHIC]
Highlights:Watching the Big Game at home with your friends & family offers many advantages.There’s more room to entertain a large crowd, and you don’t have to worry about complaints to your landlord if you cheer too loudly!The kitchen is big enough to make as many appetizers as you want, and if some of your guests are only there to watch the commercials, they can do so on a different TV in another room! … [Read more...]
Tips for Preparing Your House For Sale [INFOGRAPHIC]

Highlights:When listing your house for sale your top goal will be to get the home sold for the best price possible!There are many small projects that you can do to ensure this happens!Your real estate agent will have a list of specific suggestions for getting your house ready for market and is a great resource for finding local contractors who can help! … [Read more...]
- « Previous Page
- 1
- …
- 38
- 39
- 40
- 41
- 42
- …
- 44
- Next Page »