Some Highlights:CoreLogic’s latest Home Price Index shows that prices rose by 7.1% across the United States year-over-year.With mortgage interest rates rising in the short term, CoreLogic believes price appreciation will slow to 4.7% by this time next year.49 out of 50 states, and the District of Columbia, all had positive appreciation over the last 12 months, with the only exception being the state of Connecticut, which experienced a -0.5% appreciation. … [Read more...]
3 Tips for Making Your Dream of Buying a Home Come True [INFOGRAPHIC]
Some Highlights:Realtor.com recently shared “5 Habits to Start Now If You Hope to Buy a Home in 2017.”Setting up an automatic savings plan that saves a small amount of every check is one of the best ways to save without thinking a lot about it.Living within a budget now will help you save money for down payments and pay down other debts that might be holding you back. … [Read more...]
5 Reasons to Resolve to Hire a Real Estate Professional [INFOGRAPHIC]
Some Highlights:As we usher in the new year, one thing is for certain… if you plan to buy or sell a house this year, you need a real estate professional on your team!There are many benefits to using a local professional!Pick a pro who knows your local market and can help you navigate the housing market! … [Read more...]
Existing Home Sales Surge Through The Holidays [INFOGRAPHIC]
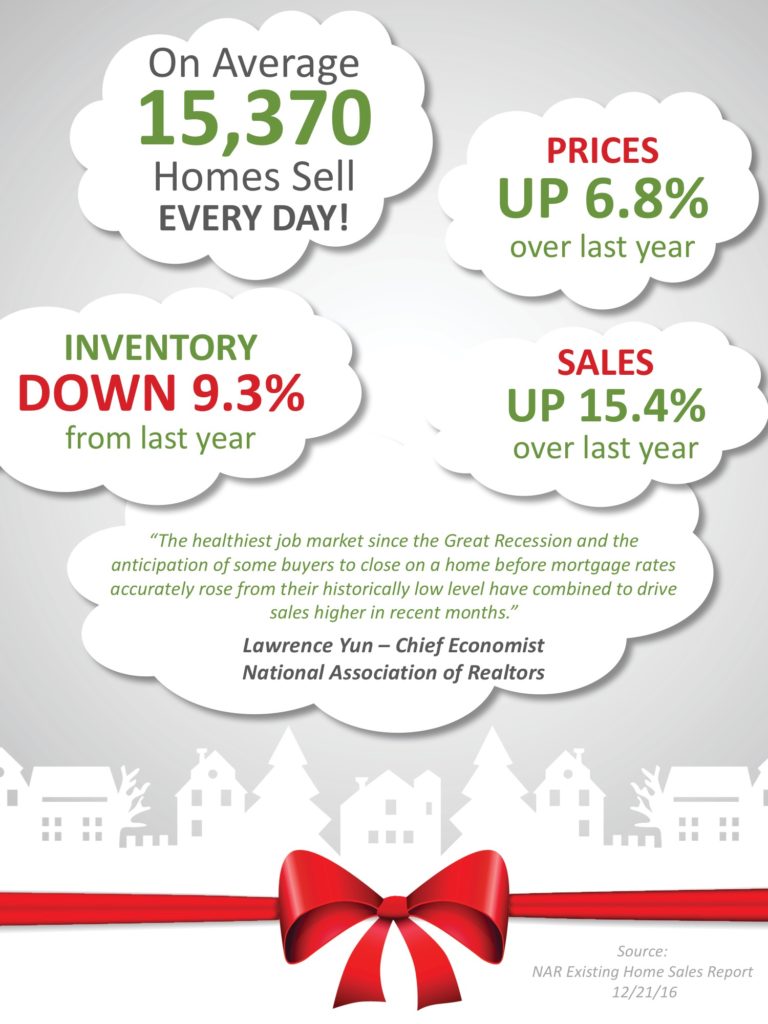
Some Highlights:November’s Existing Home Sales report revealed that sales are now at an annual pace of 5.61 million which is “now the highest since February 2007 (5.79 million) and is 15.4% higher than a year ago (4.86 million).”Total housing inventory (or the inventory of homes for sale) fell 8.0% from last month and is now 9.3% lower than November 2015.Inventory has dropped year-over-year for the last 18 months.The median price for all home sales in November was $234,900, up 6.8% from last year … [Read more...]
The Impact Your Interest Rate Has on Your Buying Power [INFOGRAPHIC]
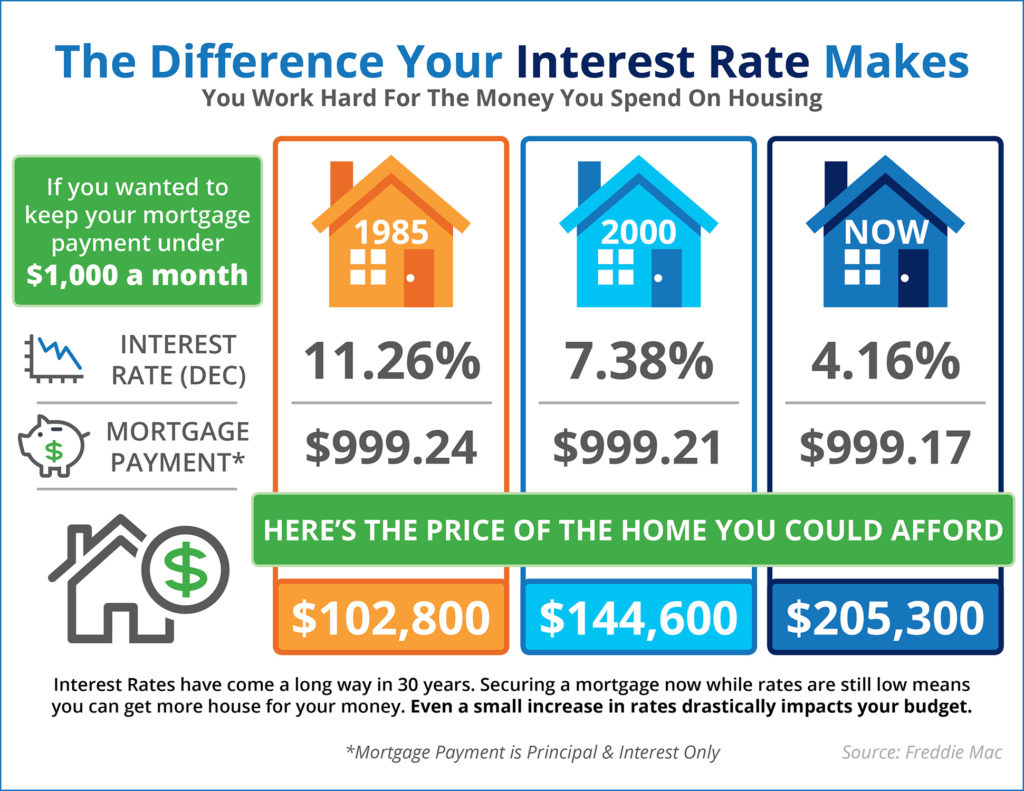
Some Highlights:Your monthly housing cost is directly tied to the price of the home you purchase and the interest rate you secure for your mortgage.Over the last 30 years, interest rates have fluctuated greatly with rates in the double digits in the 1980s, all the way down to the near 4% we are experiencing now.Your purchasing power is greatly impacted by the interest rate you secure. Act now before rates go up! … [Read more...]
Americans Are on The Move [INFOGRAPHIC]
Some Highlights:For the 4th year in a row, the Northeast saw a concentration of High Outbound activity.Oregon held on to the top stop of High Inbound states for the 3rd year in a row.Much of this Outbound activity can be attributed to Boomers relocating to warmer climates after retiring. … [Read more...]
New Home Sales Race to Keep Up with Demand [INFOGRAPHIC]
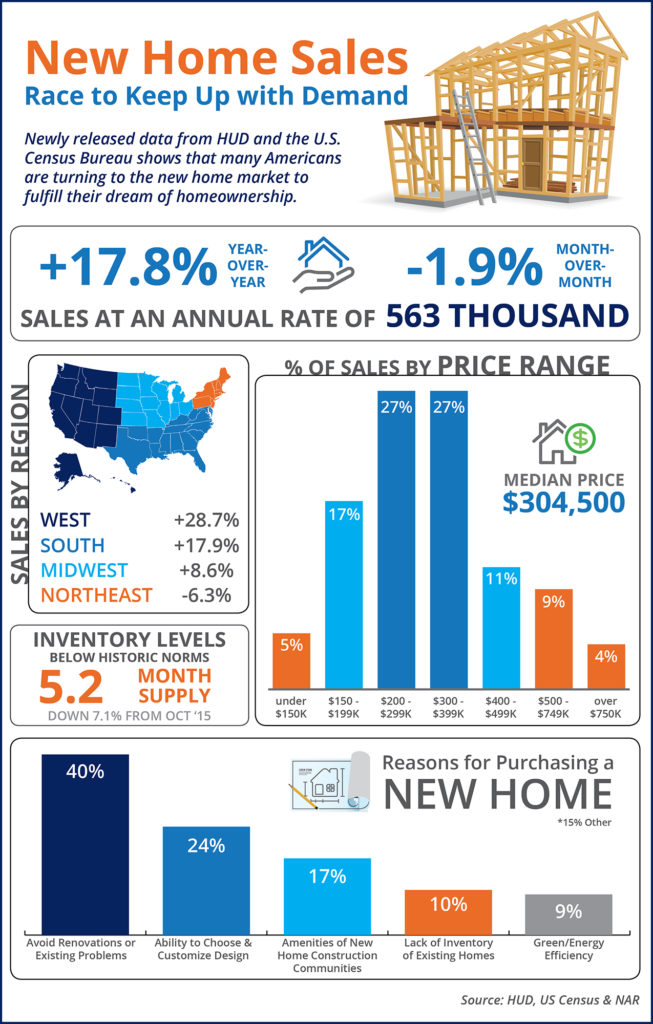
Some Highlights:Many buyers who are searching for their dream homes are turning to new home construction after 10% of all new home buyers sighted a lack of inventory of existing homes as their reason for purchase.The median home price decreased slightly from September’s high of $314,100 to $304,500 in October.The West saw the largest month over month jump in sales at 28.7%. … [Read more...]
Homes Across the Country Are Selling Fast! [INFOGRAPHIC]
Some Highlights:The National Association of REALTORS® surveyed their members for the release of their Confidence Index.The REALTORS® Confidence Index is a key indicator of housing market strength based on a monthly survey sent to over 50,000 real estate practitioners. Practitioners are asked about their expectations for home sales, prices and market conditions.Homes sold in 60 days or less in 42 out of 50 states, and Washington D.C.Homes sold in 30 days or less in 17 states. … [Read more...]
The Difference an Hour Makes This Fall [INFOGRAPHIC]
Every Hour in the US Housing Market: 633 Homes Sell253 Homes Regain Positive EquityMedian Home Values Go Up $1.43 … [Read more...]
Buying a Home Can Be Scary… Know the Facts [INFOGRAPHIC]
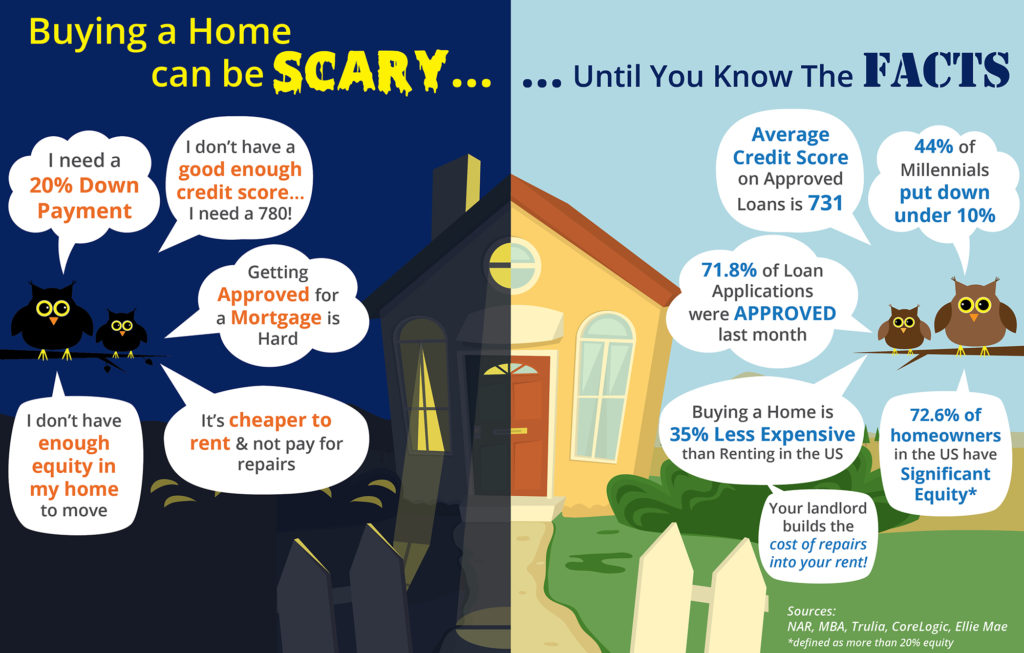
Some Highlights:36% of Americans think they need a 20% down payment to buy a home.44% of Millennials who purchased a home this year have put down less than 10%.8% of loan applications were approved last month.The average credit score of approved loans was 731 in September. … [Read more...]
- « Previous Page
- 1
- …
- 39
- 40
- 41
- 42
- 43
- 44
- Next Page »